How is cheese from pastured cows unique? (Research Brief #73)
Printer-friendly version (PDF)
What makes specialty cheese special? More specifically, what taste characteristics make cheese from pastured cows unique? These are important questions for farmers and milk processors wanting to create specialty dairy products from the milk of pastured cows. Preliminary research from UW-Madison shows that cheese from the milk of pastured cows tastes significantly different from other cheese. This study was not able to identify the chemical compounds causing the flavor differences. A consumer panel preferred the cheese made from the milk of cows fed pasture and grain, similar to the milk produced on most Wisconsin grazing dairy farms.
Scott Rankin, UW-Madison Food Science Department, and Dave Combs, UW-Madison Dairy Science Department, cooperated on a three-year study to determine differences in taste and components between milk produced by cows on three different feeding regimens: pasture only, pasture and grain, and a grain-based Total Mixed Ration (TMR, a ration that combines forage, grain, minerals, vitamins and protein supplements in one mixture) with alfalfa silage as the forage source. Their work was supported by the USDA-CSREES, the Wisconsin Milk Marketing Board and CIAS.
Setting up the trial
Fifteen first lactation Holstein cows were rotated through each of the three feeding systems using a new group of cows each year. The TMR and Pasture+Grain treatments were formulated to contain adequate energy, protein, vitamins, and minerals to support 65 lbs. of 4% fat corrected milk daily according to National Research Council guidelines.
The Pasture Only and Pasture +Grain groups were fed in a managed grazing system at the UW Arlington Agricultural Research Station. Pastures were mixtures of kura clover and low endophyte tall fescue. Portable front and back fences were used to control the cows. Fresh pasture was offered twice daily on the paddocks by moving the front fence, and the back fence was moved three times a week to limit grazing of regrowth. The paddocks were divided into three sections that were mechanically clipped to stimulate regrowth; cows grazed on forage between 14 and 21 days of regrowth. The 2004 grazing season ran from May 5 through July 15; the first 2005 pasture period was from May 25 through July 7 and the second was between August 25 and September 12.
Raw milk composition
In both 2004 and 2005, total milk production for the Pasture+Grain and TMR groups was similar (see Table 1 below). Production was lower for the Pasture Only group. Dave Combs explains, “”This was likely due to an energy imbalance caused by a lower total intake of energy when cattle have no access to supplemental grain.”” In 2004, milkfat composition was similar for cows fed pasture only and TMR, while the Pasture+Grain group had lower milkfat. Combs suggests that when grain is offered, pasture intake and therefore fiber intake may limit optimal milkfat synthesis.
In 2005, which was a drought year, milkfat production was lower for both pasture groups than for the TMR group. This suggests that cows on pasture were consuming less fiber per day than the TMR cows. The researchers did not measure pasture intake directly during the grazing study, but decreases in milkfat suggest that the drought and lower forage intake were limiting factors in 2005.
Cheese composition
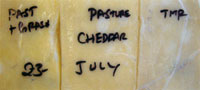
Cheese yield from the Pasture Only group was 10 to 15 percent lower than the other two groups. No significant differences in protein or moisture content of the cheeses were observed. Cheese was made by the UW Food Science Department. There was some experimental variation, primarily due to the manufacture of cheese in small vats where pressure, whey drainage and cutting are difficult to control. The cheese made from the Pasture+Grain cows was darker, with more yellowish and reddish hues than the pale TMR cheese, while the Pasture Only cheese was intermediate in color (see photo at bottom).
Flavor perception
The cheese was aged for two to four months and sent to North Carolina State University for analysis by a trained sensory panel. The panelists noticed a significant grassy note affecting the flavor of the two pasture-based cheeses. This attribute was more pronounced in the Pasture Only cheese. They also found that the TMR cheese was slightly higher in whey and milkfat flavors. The TMR and Pasture+Grain cheeses had a more buttery flavor than the Pasture Only cheese. Both of the pasture cheeses had slightly higher sulfur and broth-like flavors than the TMR cheese.
A consumer panel at North Carolina State tasted three-month old cheese. They tended to give the Pasture+Grain cheese the highest scores for flavor, texture and overall liking. When asked a forced choice preference question, 60 percent preferred this cheese. Sixty-three percent of the panelists were women; 68 percent were between the ages of 19 and 35.
Textural differences
The Pasture Only cheese was consistently softer than the cheese from the other treatments. The reasons for this are unclear. Rankin suggests it may be that the Pasture Only cheese has more unsaturated fatty acids, causing it to be softer due to an altered solid fat index. Or, the softer texture may relate to a change in the molecular structure of milk protein.
Grassy note
After extensive testing, the researchers did not identify a single compound that was the root cause of the grassy note. It may have been generated by a combination of several compounds. Rankin notes, “”Contrary to previous research, we have not been able to locate any compounds responsible for the grassy note, even though we looked specifically for these compounds at levels below their sensory threshold.””
In other studies, one of these compounds, when introduced into bland cheese, had sensory properties similar to that of the cheese from the two pasture treatments. But this study did not confirm the existence of this compound in the pasture cheeses, and further work will be needed to confirm its role in producing the grassy flavor.
Table 1. Milk yield and composition from the three feeding groups.
| Year | Pasture Only | Pasture+Grain | TMR | |
|---|---|---|---|---|
| Milk yield, lb. | 2004 | 38* | 63 | 58 |
| 2005 | 48* | 66 | 64 | |
| Milk composition | ||||
| True protein, % | 2004 | 3.0* | 3.12 | 3.09 |
| 2005 | 2.66* | 2.74 | 2.84 | |
| Fat, % | 2004 | 3.8 | 3.4* | 3.9 |
| 2005 | 3.41 | 3.36 | 3.84* | |
| SCC, x100** | 2004 | 244 | 74 | 109 |
| 2005 | 47 | 52 | 57 | |
*these values were significantly different, statistically, from the other values in the row
**SCC for all treatments indicates high-quality milk. The differences in SCC have minor biological significance.
Contact CIAS for more information about this research.
Published as Research Brief #73
January, 2007